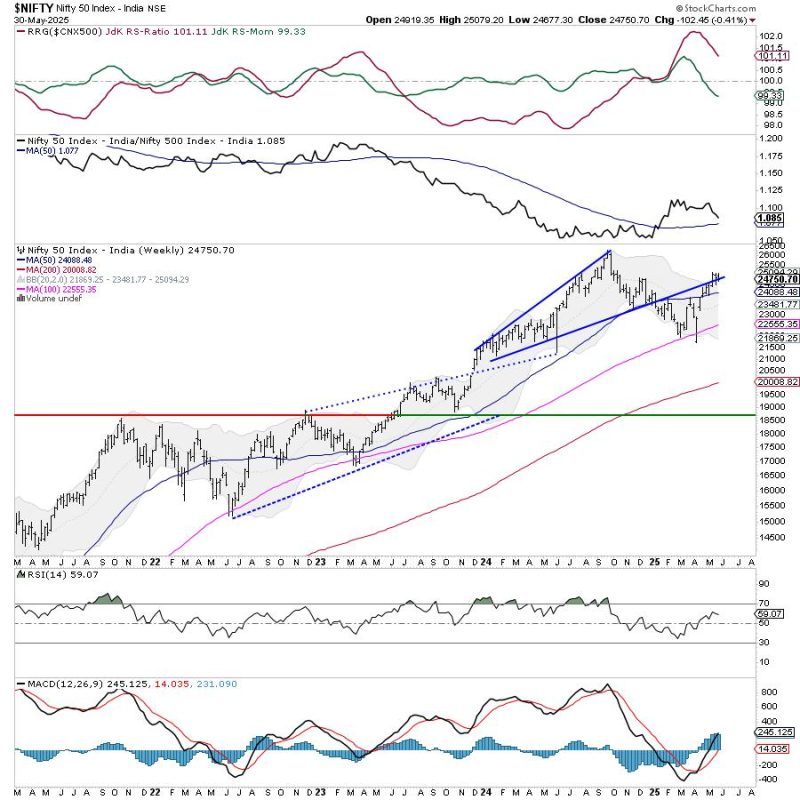
Over the past five sessions, the Indian equity markets headed nowhere and continued consolidating in a defined range. In the previous weekly note, it was categorically expected that the markets might stay devoid of any directional bias unless they either take out the upper edge or violate the lower edge of the consolidation zone. In line with the analysis, the Nifty oscillated in a 401.90-point range over the past five days. The volatility also retraced; the India Vix came off by 6.95% to 16.08 on a weekly basis. While staying absolutely range-bound, the headline index Nifty 50 closed with a minor weekly loss of 102.45 points (-0.41%).
As we step into the new week, the markets find themselves in a defined trading range, more toward the edge of the pattern support on the weekly chart. The Nifty appears to continue being in a well-defined trading range between 25100 and 24500 levels. This also implies that a directional trend would emerge only if the Nifty takes out 25100 convincingly or ends up violating the 24500 level. Unless either of these two things happens, the markets will remain devoid of directional bias and will continue staying in this defined range. The present technical structure makes it even more important to maintain a steadfast focus on protecting profits at higher levels and the rotation of sectors where a likely leadership change is visible.
The coming week is expected to see the levels of 25000 and 25175 acting as resistance points. The supports come in at 24500 and 24380 levels.
The weekly RSI is at 59.02; it stays neutral and does not show any divergence against the price. The weekly MACD is bullish and remains above its signal line.
The pattern analysis shows that after forming the most recent swing high at 25116, the Nifty has resisted this level for two subsequent weeks. This makes the level of 25100-25150 an important hurdle for the Nifty. Secondly, the Index has closed just at the support of an upward rising trendline; if this gets violated, the markets may see some more corrective retracement. Overall, the zone of 24500-24600 remains a crucial support area for the markets.
While the Nifty stays in the 25100-24500 zone and consolidates, focusing on protecting profits at higher levels would be wise. While the market keeps its underlying trend intact, it continues to remain prone to some extended corrective retracement until the levels of 25100 are taken out on the upside convincingly. During this phase, it makes more sense to keep leveraged exposures at modest levels and stay highly selective in making fresh purchases. While limiting the purchases to favorably rotating sectors, a cautious outlook is recommended for the coming week.
Sector Analysis for the coming week
In our look at Relative Rotation Graphs®, we compared various sectors against the CNX500 (NIFTY 500 Index), representing over 95% of the free-float market cap of all the listed stocks.
Relative Rotation Graphs (RRG) show that the Nifty PSU Bank Index is the only Index inside the leading quadrant that continues to improve its relative momentum against the broader markets. The other sectors present inside the leading quadrant are PSE, Infrastructure, Consumption, and FMCG, and these groups show continued paring of relative momentum against the broader markets.
The Nifty Commodities and the Nifty Bank Index have rolled inside the weakening quadrant. The Financial Services and the Services sector Indices are also inside the weakening quadrant.
The Nifty Metal Index has rolled inside the lagging quadrant. It is likely to relatively underperform along with the Pharma Index which also continues to languish inside this quadrant. The IT Index is also inside the lagging quadrant, but is seen sharply improving its relative momentum against the broader markets.
The Realty, Media, Energy, Midcap 100, and Auto Indices are inside the improving quadrant. They are likely to continue improving their relative performance against the broader Nifty 500 Index.
Important Note: RRG charts show the relative strength and momentum of a group of stocks. In the above Chart, they show relative performance against NIFTY500 Index (Broader Markets) and should not be used directly as buy or sell signals.
Milan Vaishnav, CMT, MSTA
Consulting Technical Analyst
