The Market Analyzer
  • Business
  • Investing
  • Economy
  • Stock
Trending Now
Emerging Stocks to Watch – Breakouts, Momentum &...
S&P 500, Bitcoin & XLK: What the Charts...
MACD + ADX: Spot the Pullbacks Worth Trading
S&P 500 Slide Explained: What Past Price Action...
Purepoint Completes Initial Drill Program Along Groomes Lake...
Element79 Gold Corp. Comments on Peruvian Government Reform...
Harvest Gold Soil Sampling Program Reveals Several New...
Silver47 Announces Graduation to Tier 1 Status on...
Thick High-Grade Graphite Drilling Results In New Zone
Rio Tinto Partners with Codelco to Develop Lithium...

The Market Analyzer

  • Business
  • Investing
  • Economy
  • Stock
Stock

SPY and QQQ Recapture their 200-day SMAs – Tips for Reducing Whipsaws and Improving Performance

by admin May 17, 2025
May 17, 2025
SPY and QQQ Recapture their 200-day SMAs – Tips for Reducing Whipsaws and Improving Performance

SPY and QQQ crossed above their 200-day SMAs with big moves on Monday, and held above these long-term moving averages the entire week. The V-Reversal was extraordinary and SPY seems short-term overbought, but this cross above the 200 day SMA cross is a bullish signal for the most important market benchmark. Despite a bullish signal, long-term moving averages are trend-following indicators and it is important to set realistic expectations.

***** This is an abbreviated version of a research report covering the 200-day SMA, performance improvements and a twist for QQQ. Recent reports at TrendInvestorPro covered the V-Reversal, the Bottoming Process and an Exit Strategy for the Zweight Breadth Thrust. Click here to take a trial and get immediate access. *****

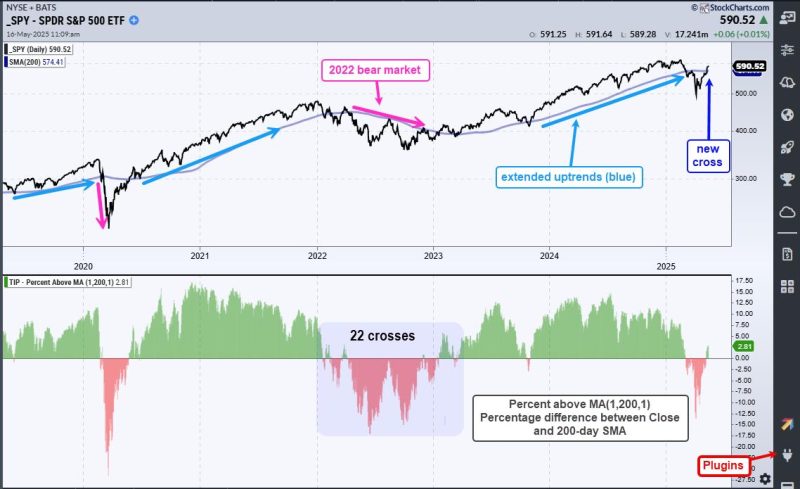
The chart below shows SPY with the 200-day SMA (blue). This 200-day cross captured two big uptrends since 2020 and foreshadowed the bear market in 2022. Even though these three signals look great, there were plenty of whipsaws along the way. SPY crossed the 200-day SMA 141 times since 2005, which averages 7 crosses per year. Averages can be deceptive because some years have more crosses than others. SPY did not cross its 200-day in 2021 and 2024, but there were 22 crosses between January 2022 and March 2023.

The indicator window shows Percent above MA (1,200,1) to better highlight these crosses. It turns positive (green) with a bullish cross and negative (red) with a bearish cross. The values are the percentage difference between the close and the 200-day SMA.  

There is no such thing as a perfect indicator. Trend-following indicators are great at catching big trends, but they are also prone to whipsaws (failed signals). Whipsaws are simply the price of admission for a trend-following strategy. We must take the good (big trends) with the bad (whipsaws). As the chart above confirms, trend-following works over time because one good trend pays for the whipsaws.

Chartists can improve 200-day SMA signals with a little smoothing. For example, use a 5-day SMA instead of the close. Since 2005, the 5-day SMA crossed its 200-day SMA 55 times, which averages out to 3 per year. Fewer signals means fewer whipsaws. Also note that this smoothing generated higher returns and lower drawdowns.

The chart above shows the SPY with Percent above MA (5,200,1). This indicator captures the percentage difference between the 5 and 200 day SMAs. Instead of 22 crosses between January 2022 and March 2023, the 5-day SMA crossed the 200-day SMA just 8 times. This indicator is part of the TIP Indicator Edge Plugin for StockCharts ACP.

We can reduce whipsaws even more by adding a signal filter. This next section will cover signal filters and performance metrics for SPY. We then show how other ETFs perform and add little twist to improve performance for QQQ signals. This section continues for subscribers to TrendInvestorPro. Click here to take a trial and get immediate access. 

////////////////////////////////////////
previous post
Rio Silver Receives Conditional Approval for Acquisition of Mamaniña Exploraciones S.A.C.
next post
Applying Dow Theory to Today’s Market: Are We in a Reversal or a New Trend?

Related Posts

Stock Market Wrap: Stocks Rebound as May Kicks...

May 3, 2025

The S&P 500 Snapped Back Hard: Now What?

May 16, 2025

Top Stock Areas After the Rally: What Smart...

April 26, 2025

Use This Multi-Timeframe MACD Signal for Precision Trades

May 8, 2025

Two EASY Ways to Find the Strongest Stocks...

April 26, 2025

S&P 500 Rises from Bearish to Neutral, But...

April 28, 2025

Four Charts to Track a Potential Market Top

May 6, 2025

50% of S&P 500 Stocks Just Turned Bullish...

May 14, 2025

Zweig Breadth Thrust Dominates the Headlines – But...

April 27, 2025

The Best Five Sectors, #18

May 6, 2025

    Fill Out & Get More Relevant News


    Stay ahead of the market and unlock exclusive trading insights & timely news. We value your privacy - your information is secure, and you can unsubscribe anytime. Gain an edge with hand-picked trading opportunities, stay informed with market-moving updates, and learn from expert tips & strategies.

    Recent Posts

    • Emerging Stocks to Watch – Breakouts, Momentum & Upgrades!
    • S&P 500, Bitcoin & XLK: What the Charts Are Saying Now
    • MACD + ADX: Spot the Pullbacks Worth Trading
    • S&P 500 Slide Explained: What Past Price Action Reveals About Market Dips
    • Purepoint Completes Initial Drill Program Along Groomes Lake Conductive Corridor at Smart Lake JV

    Popular Posts

    • 1

      Stock Market News UK Update: FTSE 100 & 250 Rise

      April 16, 2025
    • 2

      Bitcoin Rebounds to $83,404 Amid Renewed Investor Confidence

      April 21, 2025
    • 3

      Stock Market News UK Update: FTSE 100 & 250 Rise

      April 17, 2025
    • 4

      Stock Market News UK Update: FTSE 100 & 250 Rise

      April 17, 2025
    • 5

      Stock Market News UK Update: FTSE 100 & 250 Rise

      April 20, 2025

    Categories

    • Business (64)
    • Economy (20)
    • Investing (237)
    • Stock (104)
    Footer Logo
    • Privacy Policy
    • Terms & Conditions

    Disclaimer: themarketanalyzer.com, its managers, its employees, and assigns (collectively “The Company”) do not make any guarantee or warranty about what is advertised above. Information provided by this website is for research purposes only and should not be considered as personalized financial advice. The Company is not affiliated with, nor does it receive compensation from, any specific security. The Company is not registered or licensed by any governing body in any jurisdiction to give investing advice or provide investment recommendation. Any investments recommended here should be taken into consideration only after consulting with your investment advisor and after reviewing the prospectus or financial statements of the company.

    Copyright © 2025 themarketanalyzer.com | All Rights Reserved